Detecting 'complex' trends
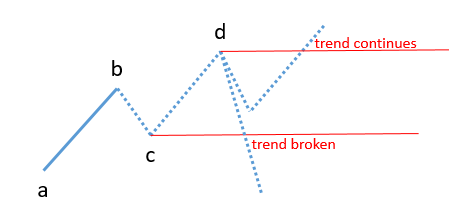
The initial test couldn’t answer the question of how many trends continue, because it couldn’t decide which pivot breaks first, c or d.
If it’s c, the trend is broken but if it’s d, the trend continues.
In order to answer this question I’ve written a new TradeStation ‘ShowMe’ called TrendPublisher (plus a bunch of analysis code in Octave).
Unlike AdaptiveZigZag, TrendPublisher does not assume that a,b,c,d, etc are consecutive pivots, as they would be in a simple trend.
Instead, it allows each of the dotted legs in the diagram above to be any sequence of pivots, provided that a,b,c,d,etc are still the extreme points of each leg. For example in an uptrend, b is always the highest point between a and c, and c is always the lowest point between b and d.
I’ll call the trend abcd (ie from point a to point d) simple if a,b,c and d are consecutive pivots, otherwise I’ll call it complex.
Here are some examples.
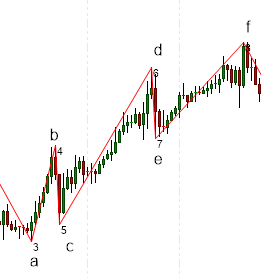
Here is an uptrend where abcd is simple.
The trend continues because point d breaks before c:
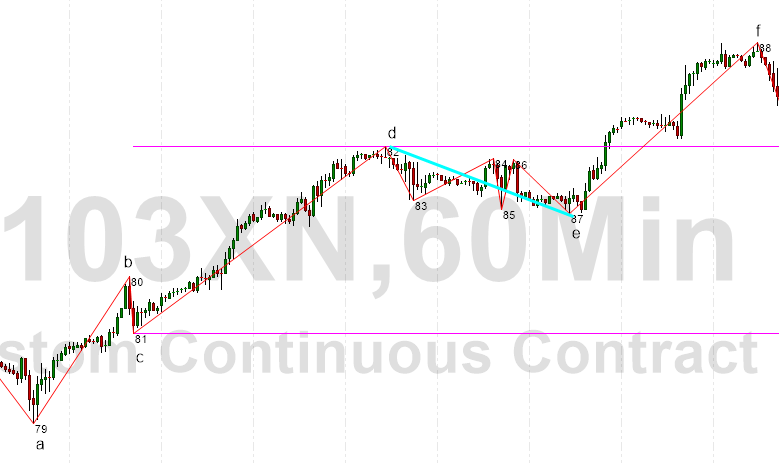
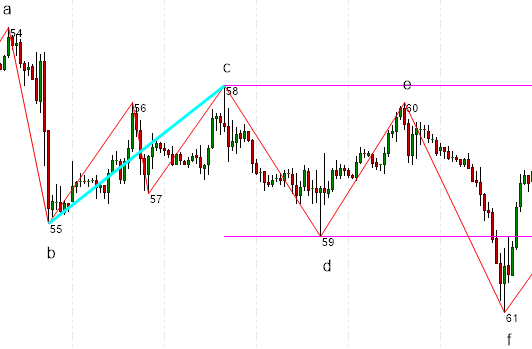
In the next chart abcd is simple but the price subsequent action prior to breakout is complex.
I’ve drawn the complex leg de and horizontal lines through c & d for clarity:
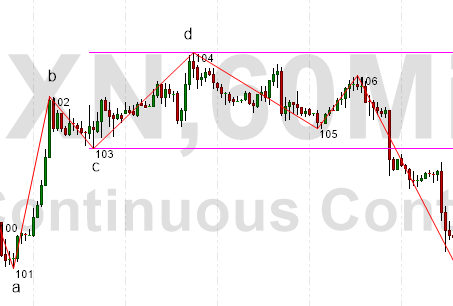
Here abcd is simple but the break of trend is complex (i.e. the first pivot does not break the trend):
In this last example, which contains a downtrend that continues, bc is complex but the subseqent action is simple:
Developing TrendPublisher took a good deal of testing but it provides the capability to complete the initial study. I’ll publish the results in the next post.