Results of the initial study
| Here are the results for the initial study of 2019 hourly crude oil futures. For reference, I’ve included the diagram from the previous post: | 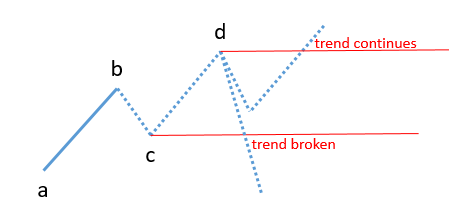 |
| Uptrends | Downtrends | All | |
|---|---|---|---|
| total no. trends | 76 | 56 | 132 |
| d breaks before c | 42 | 24 | 66 |
| % d breaks before c | 55% | 43% | 50% |
| trends where abcd is simple: | |||
| no. of trends | 61 | 48 | 109 |
| d breaks before c | 30 | 21 | 51 |
| % d breaks before c | 49% | 44% | 47% |
| trends where abcd is complex: | |||
| no. of trends | 15 | 8 | 23 |
| d breaks before c | 12 | 3 | 15 |
| % d breaks before c | 80% | 38% | 65% |
I’ve broken out the trends in which pivots abcd are simple - these are the same 109 trends that were identified in my 20 May post.
So, what does this tell us? Here are my initial thoughts:
It’s disappointing that, overall, only 50% of trends in this sample continued (i.e. broke out beyond point d to make a new extreme). However, this is just one test, for a specific combination of Retracement Threshold and time-frame (hourly candles). It will be interesting to see whether changing either parameter, or indeed the market or year, makes a difference.
The most eye-catching result is the 80% of complex uptrends that continue. I’ll watch out for this in subsequent studies but I have to say the numbers are small and I would not be surprised if this is a random fluke.
Still, it’s good to have reached this point and to finally have some results.
Having spent quite a while developing & testing TrendPublisher I’m now going to see what other insights it can provide.
More to follow!
Test Details
Same as for the 20 May post, i.e. hourly crude oil chart for the whole of 2019, using unadjusted prices and a Threshold Multiple of 3.