An initial study
Now let’s see if the foundations established in the previous posts allow us to tackle some of the interesting questions about trends.
We need a decent-sized data set, so I’ve used AdaptiveZigZag to identify the turning points from a whole year’s worth of hourly crude oil futures data (I’ve put the details at the bottom of this page to avoid clutter).
It’s easy enough to identify each sequence of 4 consecutive pivots a, b, c & d that meet the criteria for a trend described earlier.
Then we can count how often the next pivot, e, breaks the trend (i.e. is below c in an uptrend 1).
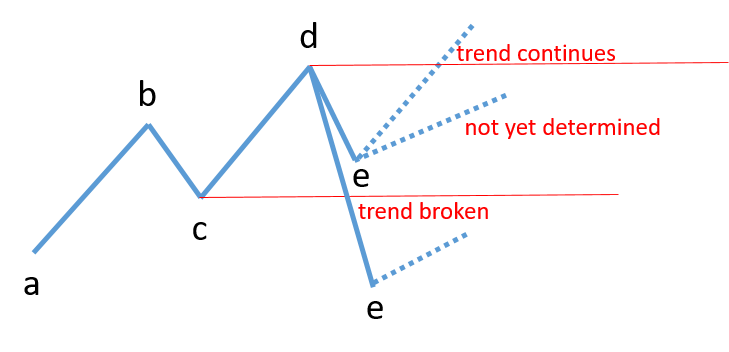
Now, does this tell us how often trends continue? Unfortunately the answer is ‘not really’. The key question is which pivot breaks first, c or d? If it’s c, the trend is broken but if it’s d, the trend continues (making pivot e the new controlling low).
Deciding which breaks first is more complicated than looking at one more pivot - the chart could bounce around between the horizontal red lines making many pivots. This requires more complicated analytical software because we don’t know how many more pivots we have to examine. I’ll return to this in later posts (I do have a solution) but for now, let’s see what value we can extract from the simple trend analysis described above.
After all,
- if e ‘breaks’ c the trend is definitely over
- if not, then we have at least a reasonable bounce in price, even if the subsequent move doesn’t reach d.
Here are the counts for the simple trend:
| Uptrends | Downtrends | All | |
|---|---|---|---|
| simple trends | 61 | 48 | 109 |
| e breaks c | 26 | 20 | 46 |
| e doesn’t break c | 35 | 28 | 63 |
| % e breaks c | 43% | 42% | 42% |
| % e doesn’t break c | 57% | 58% | 58% |
So, in this example, we can say that at least 42% of the trends didn’t continue.
58% put in a new pivot without breaking the controlling low(or high) but we don’t yet know how many of those broke out to make new highs.
However the fact that pivot e was recorded means that price turned at e and moved at least 3x the average candle range (that’s the definition of a pivot using a Retracement Multiple of 3).
In this test the average Retracement Threshold was 91c which equates to $910 per futures contract, which is what I meant by a reasonable bounce.
There are many other interesting questions that we could try to quantify now that we have some test data, such as:
- how deeply does the move from d to e typically retrace the move from c to d?
- what happens if we use higher or lower timeframes than hourly?
- what’s the effect of using different Threshold Multiples?
- how do different markets compare?
but I’m going to defer those until we’ve discussed more complex trends.
Test Details
Price data: hourly crude oil chart for the whole of 2019, using unadjusted prices (TradeStation ticker is @CL=103XN).
As described earlier, I’m using Threshold Multiple of 3.
AdaptiveZigZag writes all the turning points to a file which I then analyse using the Octave matrix processing language.
Footnotes
1 remember, the opposite is true for a downtrend - I won’t clutter up the text by spelling out what the mirror image looks like