Problems choosing turning points
In the previous post I showed what we mean by uptrends and downtrends. This works well provided the turning points a, b, c & d are obvious. But now let’s look at a more difficult case. This diagram shows a downtrend with price falling from high a to low b, rallying and then breaking down through b, leaving c as the controlling high.
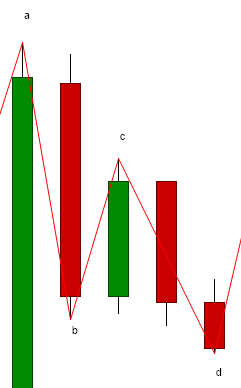
Are a, b, c and d good choices of turning points? Notice that we could have ignored b and c and treated a to d as a single move. What is the best approach?
The usual advice is to chose the obvious “turning points” where price changed direction. Often the beginner is helpfully told they can ignore minor moves. Not only is this hopelessly vague for an computer, but it also conceals a genuine difficulty for the novice.
For this investigation it is crucial that we remove this subjectivity when determining trend. Here’s my approach:
- unless the price difference between b & c is significantly more than the average candle’s range, don’t treat b & c as turning points.
- if however, this snapshot represented a period of dramatic price moves, the difference c-b might be much greater than the average candle. In that case I would happily treat b & c as turning points.
To be precise, what this boils down to is:
i) I only treat the high or low of a candle as a turning once price has retraced more than a minimum price move in the opposite direction. I’ll refer to this minimum price move as the Retracement Threshold.
ii) this minimum price move is significantly larger than the range of the average candle.
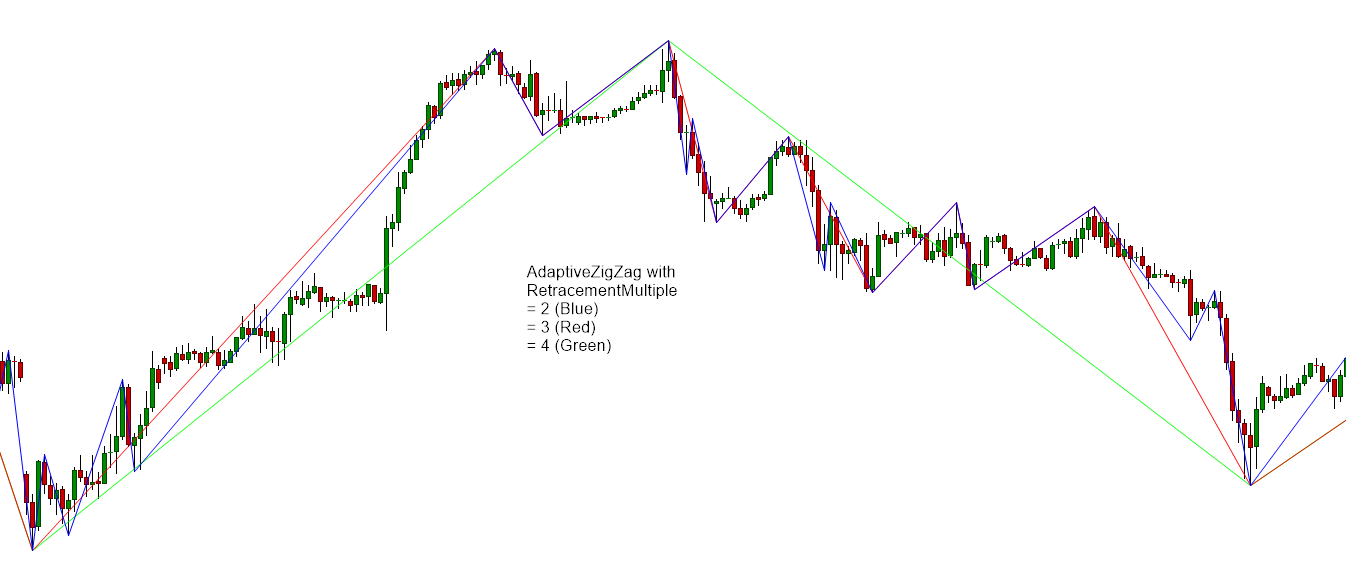
To provide an objective foundation for this project (and for my trading in general) I have coded a TradeStation analysis technique called AdaptiveZigZag which sets the Retracement Threshold at a fixed multiple of the average candle range. I call this the Retracement Multiple. I’ve found it useful to calculate the average range using an exponential moving average*, so that the code adapts to longer-term changes in volatility.
So AdaptiveZigZag adapts in two senses:
1) to the price range of each market (essential when switching between markets using the same chart)
2) to longer-term changes in volatility.
Here’s a screen shot showing how increasing the value of RetracementMultiple causes AdaptiveZigZag to ignore smaller moves. In practice I find that setting it to a value of 3 consistently captures the turning points that “look right” to me.
* I don’t want my minimum price move to vary much with the daily cycle of volatility (which, for futures, is high during the regular session and low overnight). Using a 100 period exponential moving average achieves this at the timeframes I typically trade.