Trend basics
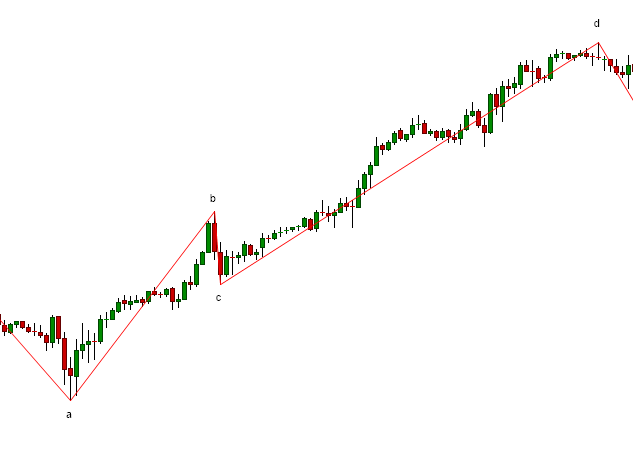
The simplest definition of an uptrend is where price starts from a low, rises to a local high, then falls to a local low then breaks out to make a higher high.
There are other ways to define trend. For example many people will try to draw a trend line joining the lows in an uptrend.
For now, I’m looking for the simplest possible rules for trends, so I’ll stick with the picture above in which an uptrend occurs when we have higher highs (“HH”) and higher lows (“LL”).
A downtrend is the mirror-image, with lower highs (“LH”) and lower lows (“LL”).
It would be very tedious to state everything twice, once for an uptrend and once for a downtrend.
So, from now on everything I say about an uptrend(downtrend) will apply to to the mirror-image downtrend(uptrend) as long as we replace “high” with “low” and vice-versa.
Now we know the pattern that we’re looking for, let’s look at how it formed and in particular, at what point did we know we had an uptrend?
I’ve labelled the turning points a, b, c & d.
I’ve joined the turning points with red lines for emphasis. Note that these red “zig-zag” lines are not trend lines (mentioned above) because they merely join highs and lows, rather than successive lows.
For the moment assume that these turning points are obvious (later on I’ll explore why this is not always so).
We don’t know we have an uptrend until price breaks out above b (this happened at some time during the candle marked with an arrow).
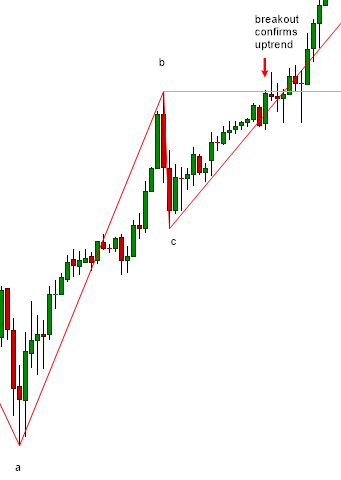
Once the breakout happens, we can identify the point c, the new higher low (“HL”). This is the lowest price between point b and the breakout.
It’s important to realise that we don’t know point c until point b is broken - if price had dropped then rallied, point c could have been lower than the one shown.
Nor, at the time of the breakout, do we know the price of point d, the eventual higher high (“HH”), we just know that there must be a HH.
Point c is the most recent HL and is called the controlling low of the uptrend. Each uptrend has a single controlling low. If the trend continues, the controlling low may be replaced by a new, higher controlling low. But if the controlling low is broken, the uptrend is over.
By symmetry, every downtrend has a single controlling high, which is the most recent lower high (“LH”).